Vacancy Cost Calculator
See what open roles cost you in a year, and what you save by filling them faster or keeping people longer. Enter your headcount, turnover, and time to fill, and the workbook returns the annual vacancy cost, the average seats empty, and the saving from each lever.
One-time purchase, no subscription. Instant download.
Built to the TrueStep HR standard
- The yearly cost of open roles in an open model: headcount, turnover, and time to fill turned into an annual vacancy cost, the average seats empty at any moment, and the share of payroll it represents, with every formula visible and editable in Excel or Google Sheets
- Two savings levers, costed: what you save by filling roles faster and by lowering turnover, each on its own and the two together, so you can size a recruiting or retention investment against what it returns
- An adjustable cost-of-vacancy factor: the one assumption that moves the result most, set to your situation, full daily loaded pay for a typical role and higher for revenue or hard-to-cover seats
- A board-ready summary and sourced benchmarks: a one-page Summary for a leadership conversation, and a Benchmark tab with turnover, time-to-fill, and cost-of-vacancy figures cited to SHRM, BLS, Mercer, and Gallup
- A working file you keep: a pre-filled worked example, your numbers saved, and the method documented in plain English, not a one-time screen
The workbook computes from the numbers you enter. Your headcount, turnover, time to fill, and the cost-of-vacancy factor are yours to set.
14-day money-back guarantee. If it does not help, email us and we refund you.
The result rests most on the cost-of-vacancy factor, how much of an open seat’s value the team loses rather than absorbs, so set it to your situation and treat the figure as a way to size the cost of open roles, not a precise ledger entry.
Not the right fit? Take the 60-second match.
One Excel workbook that turns headcount, turnover, and time to fill into the yearly cost of open roles
A working model, not a blank sheet. You enter your workforce and cost assumptions, the workbook returns the annual vacancy cost and what each lever saves, and it opens on a worked example so the logic is clear before you change anything.
Vacancy Cost Calculator
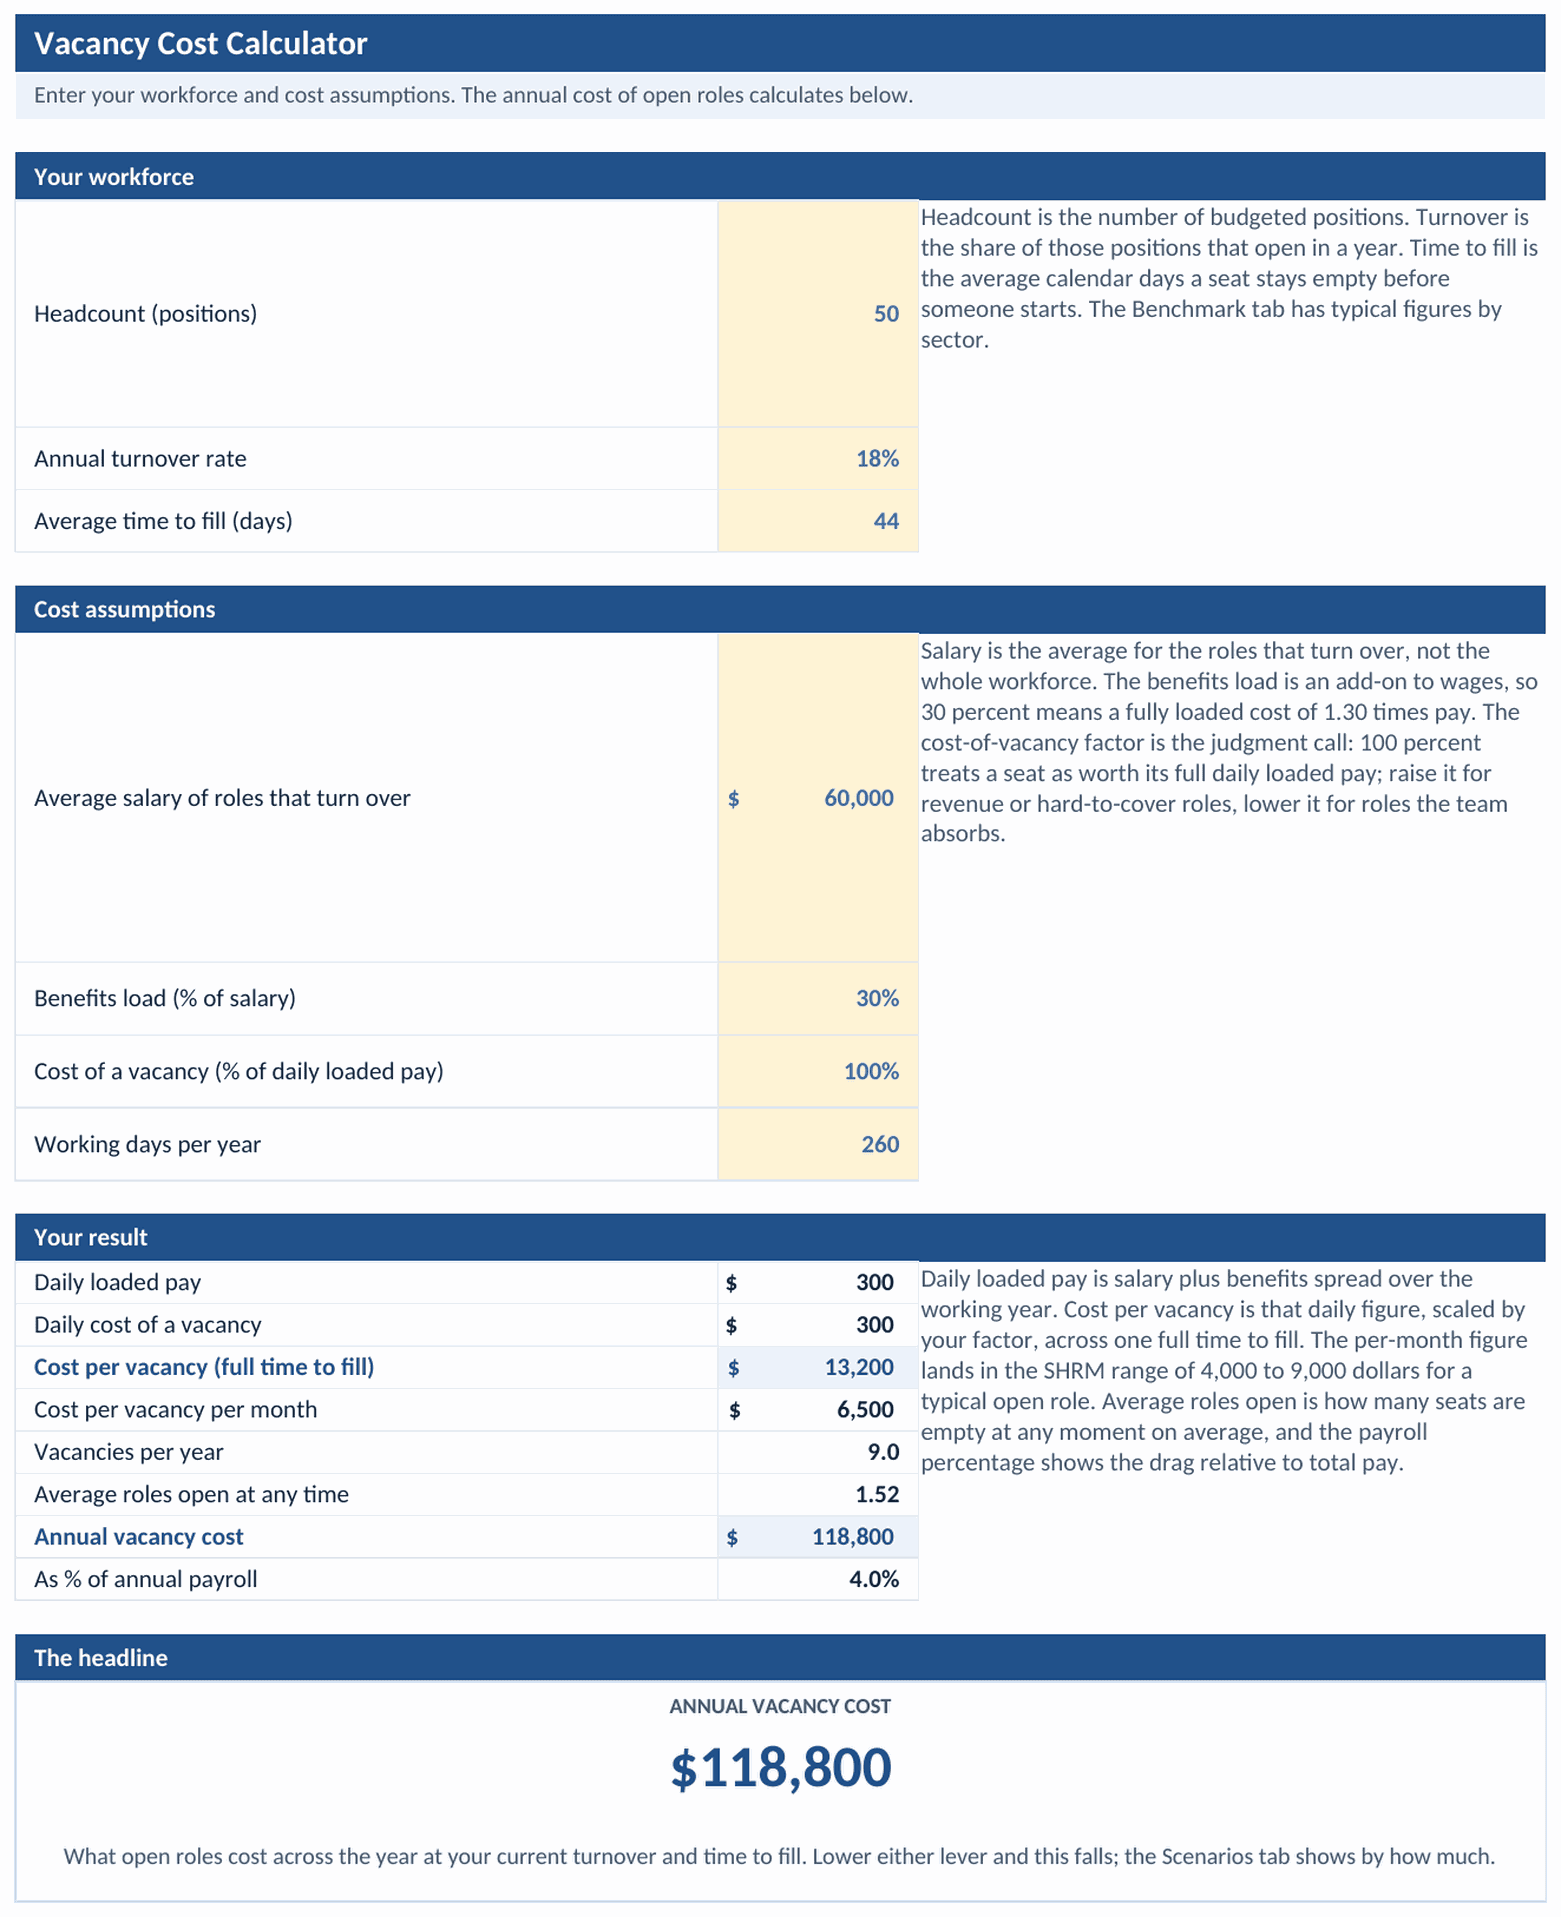
Enter your headcount, annual turnover rate, and average time to fill, then set the salary and benefits load for the roles that turn over and the cost-of-vacancy factor. The workbook returns the daily loaded pay, the cost of one open role across a full time to fill, the monthly run rate, the average seats empty at any moment, the annual vacancy cost, and the share of payroll it represents.
Two savings levers, a board-ready summary, sourced benchmarks, and the method in plain English
A Scenarios tab puts a number on filling faster and on lowering turnover, each alone and the two together. A one-page Summary carries the annual cost and the headline figures for a leadership conversation, a Benchmark tab holds turnover, time-to-fill, and cost-of-vacancy figures from SHRM, BLS, Mercer, and Gallup, and the Notes tab documents how each number is built.
Three steps from headcount and turnover to the cost of open roles
You enter your workforce, read the annual cost, and test the two levers. The workbook does the rest.
Enter your workforce and cost assumptions
Fill the amber cells: headcount, annual turnover rate, average time to fill, the average salary and benefits load for the roles that turn over, the cost-of-vacancy factor, and working days per year. The worked example runs 50 positions at 18% turnover and a 44-day time to fill, change it to your own numbers.
Read the annual cost
The workbook spreads loaded pay over the working year, scales it by your factor across a full time to fill for the cost of one open role, and multiplies by the roles that open across the year for the annual vacancy cost, with the average seats empty and the share of payroll alongside.
Test the two levers
The Scenarios tab shows what you save by filling faster and by lowering turnover, each on its own and together. Use the saving to size a recruiting or retention investment: if a change costs less than it saves here, the numbers support it. The Summary rolls it up for a leadership conversation.
Open roles get counted as a gap to fill, not as a cost that runs every day
Two habits get vacancy cost wrong. The first treats an open role as a temporary gap and a saved salary, missing the output and overtime it drains while it sits empty. The second prices a single open seat once and forgets that vacancies are recurring, so a share of the workforce is empty at any given moment all year. A model that runs the cost across the year, and lets you set how much of a seat the team loses, gives a figure a finance partner will accept.
Who this calculator fits and where to go if that is not you
It puts a yearly number on open roles, what they drain and what each lever saves, with a board-ready summary. For the full cost of a departure, the value lost on one specific open role, or the recruiting spend to fill it, the right tool is next to it.
Built for
- An HR or talent leader building the case for a recruiting or retention investment who wants the yearly cost of open roles, not a saved-salary line.
- A finance or operations partner who wants vacancies costed across the year, with the cost-of-vacancy factor set to the role and the saving from each lever sized.
- An owner or manager carrying open seats who wants to see what they drain and what filling faster or keeping people longer would save.
If you are looking for
- The full all-in cost of one person leaving and being replaced, recruiting, ramp, and lost productivity, not the value lost while the seat is empty. The Cost of Turnover Calculator covers that.
- Pricing each specific open role by its own days open and value, role by role, rather than a workforce-level annual figure. The Time-to-Fill Cost Calculator does that.
- The recruiting spend to fill a role, the ads, agency fees, and staff time. The Cost Per Hire Calculator sizes it.
Before you buy
What format is it and can I edit it?
How accurate is the result?
How is this different from the free calculator?
How do I set the cost-of-vacancy factor?
What is the refund policy?
What happens after I buy?
Can I expense this purchase to my business?
Most customers buy TrueStep HR tools for business use, and a tool you use for work often qualifies as a deductible business expense. Whether it does for you depends on your situation, so confirm with your accountant or tax professional. Your receipt arrives by email at checkout and works as documentation.
The 6 red flags to check before you discipline or fire someone
A five-minute screen to run before you act. Free PDF, sent to your inbox. Unsubscribe anytime.
This tool is built on published method and current rules. Read the basis yourself:
What buyers say
Put a number on the open roles, not a saved salary
Enter your headcount, turnover, and time to fill, and the workbook returns the annual vacancy cost and what filling faster or lowering turnover would save, in a file you keep.