Span of Control Calculator
See how many direct reports each manager carries, on average, and what reshaping your structure would do to management cost. Enter your headcount and manager count, and the workbook returns your average span, your org layers, the managers a target span would call for, and the dollar change from getting there.
One-time purchase, no subscription. Instant download.
Built to the TrueStep HR standard
- Your span of control, read against your structure: the average direct reports per manager, the individual contributors, the managers as a share of the workforce, and a rough layer count, every formula visible and editable in Excel or Google Sheets
- The cost of reshaping spans: set the extra pay a manager carries over an individual contributor, and the workbook returns your management premium now, the premium at a target span, and the dollar change from getting there
- A target span, sized in managers: set the reports per manager you want to plan toward, and see how many managers that calls for and the gap to your count today
- Sourced span benchmarks: typical spans by the nature of the work, the McKinsey archetypes from player-coach to coordinator, with the current Gallup, Pave, and BLS figures cited, to sense-check your target
- A working file you keep: a pre-filled worked example, your numbers saved, and the method documented in plain English, not a one-time screen
The workbook computes from the numbers you enter. The headcount, the manager count, the target span, and the manager pay premium are yours to set.
14-day money-back guarantee. If it does not help, email us and we refund you.
The result rests most on a clean count of who manages people and the pay premium you set, so define a people-manager as anyone with at least one direct report, and treat the figures as a way to size your structure and its cost, not a precise org chart or a layoff plan.
Not the right fit? Take the 60-second match.
One Excel workbook that turns a headcount and a manager count into your span, your layers, and the cost of reshaping them
A working model, not a blank sheet. You enter the headcount and the managers, the workbook returns the structure and what a target span would cost or save, and it opens on a worked example so the logic is clear before you change anything.
Span of Control Calculator
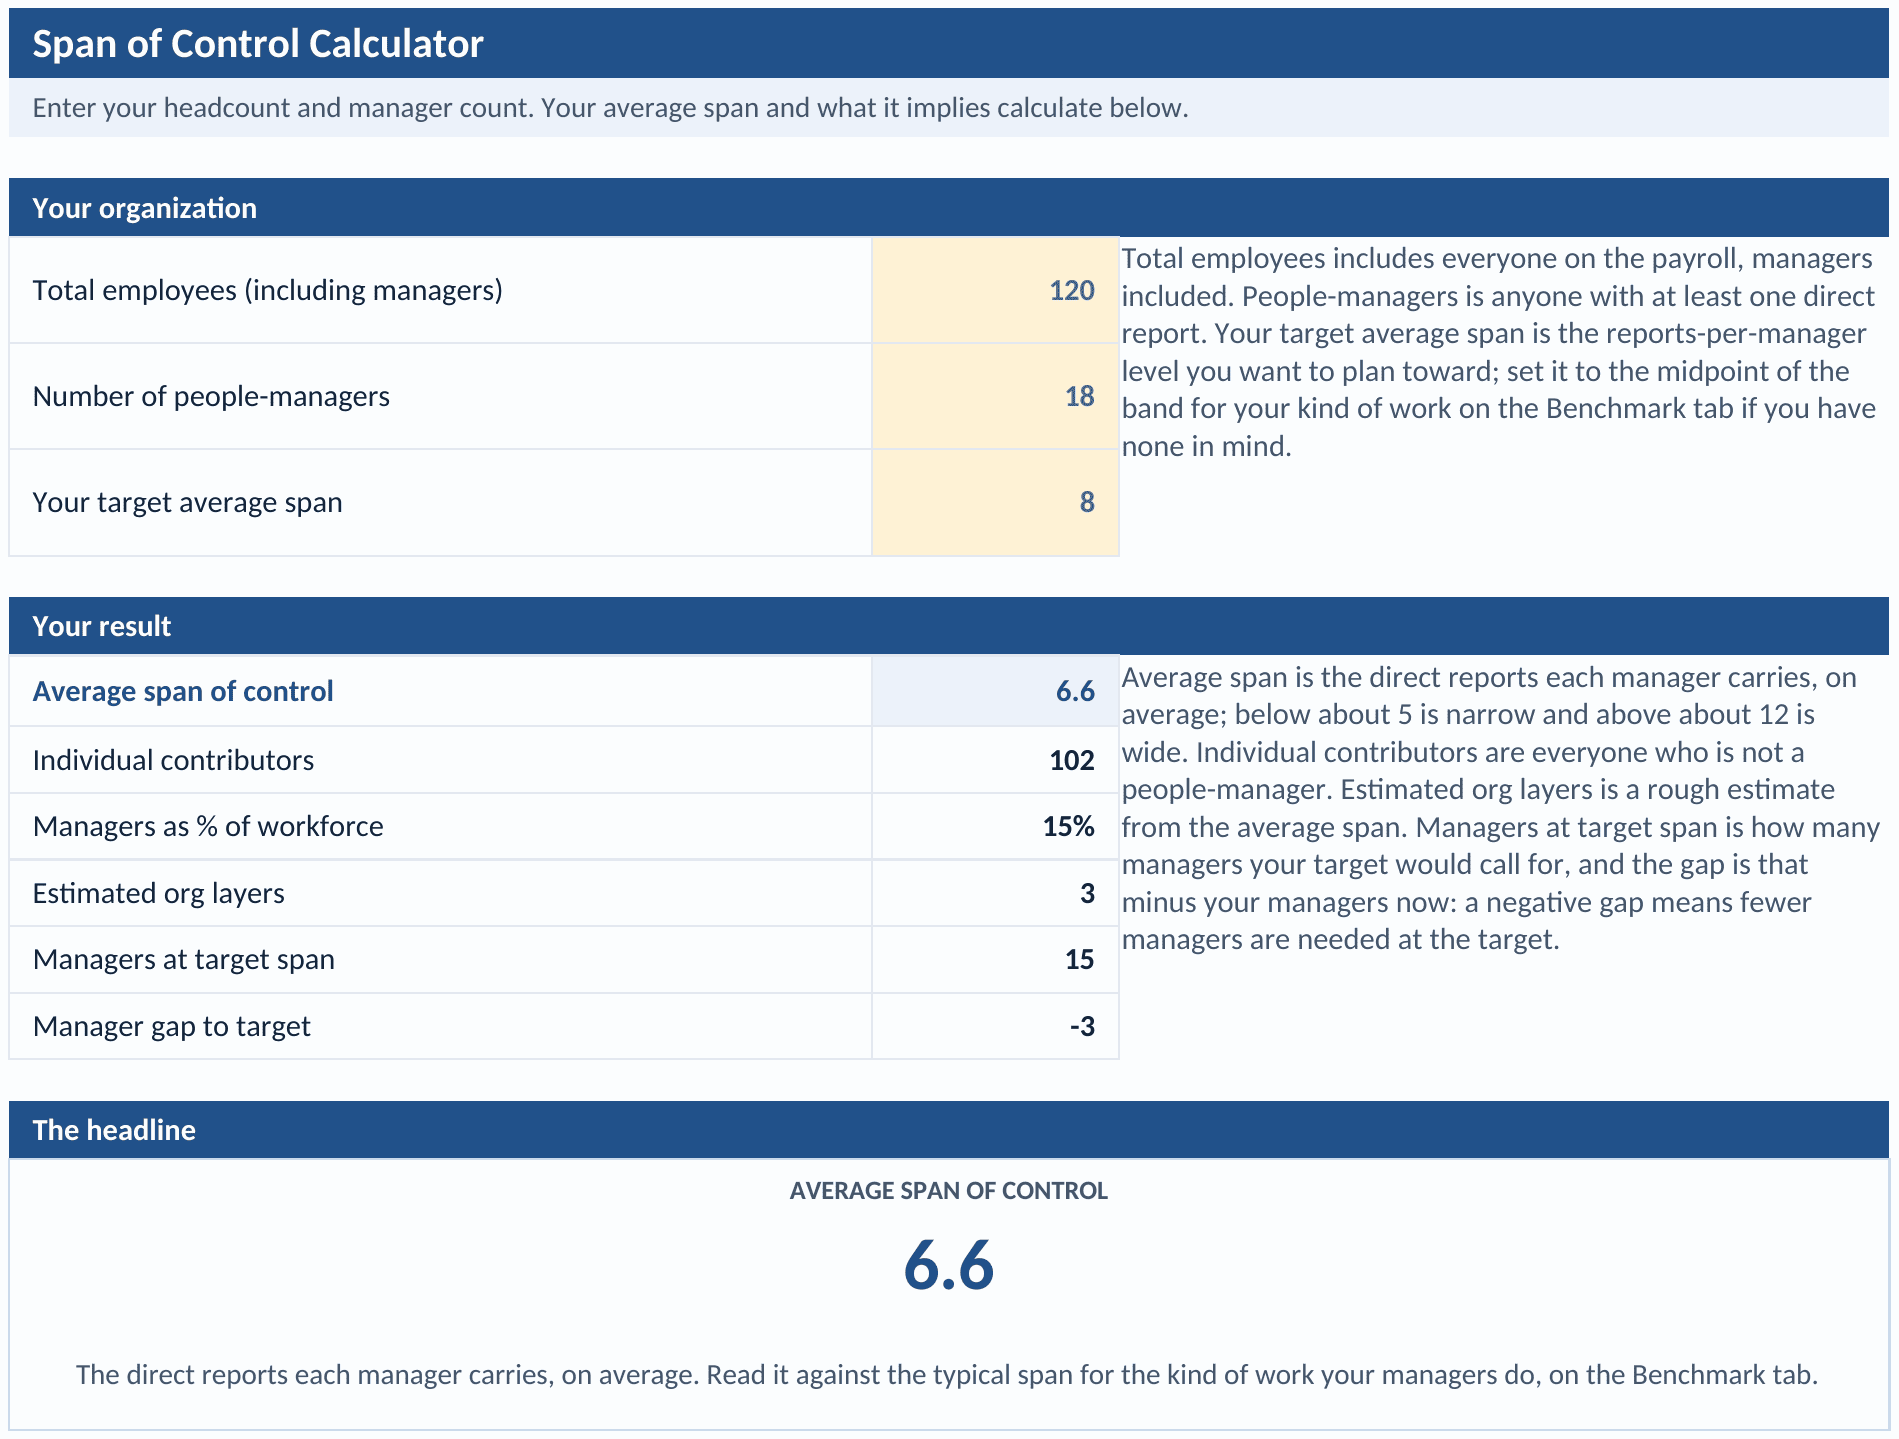
Enter your total headcount including managers, the number of people-managers, and a target span. The workbook returns your average span of control, the individual contributors, the managers as a share of the workforce, the estimated org layers, the managers a target span would call for, and the gap to your count today.
An org-design and cost tab, a board-ready summary, sourced benchmarks, and the method in plain English
An Org Design and Cost tab turns a target span into a manager count and a change in management cost, using the pay premium a manager carries over an individual contributor. A one-page Summary carries the headline numbers for a leadership conversation, a Benchmark tab holds typical spans by the nature of the work from McKinsey, Gallup, Pave, and the BLS, and the Notes tab documents how each number is built.
Three steps from a headcount and a manager count to your span and its cost
You enter the organization, read your structure, then cost a target span. The workbook does the rest.
Enter your headcount and managers
Fill the amber cells: total employees including managers, the number of people-managers, and a target span if you have one in mind. The worked example runs a 120-person organization with 18 managers and a target span of 8, change it to your own numbers.
Read your structure
The workbook divides your employees, less the one top leader, by your managers for the average span, then derives the individual contributors, the management share, a rough layer count, and the managers a target span would call for, with the gap to your count alongside.
Cost the change
The Org Design and Cost tab turns the manager gap into a dollar figure using the pay premium a manager carries over an individual contributor, so you see what reshaping spans adds to or removes from management cost. The Summary rolls it up for a leadership conversation.
Spans set how many managers you carry and what you pay to carry them
Two habits get the cost of a structure wrong. The first reads the manager headcount on its own, when the number that matters is the span behind it: 18 managers over 120 people is a different organization at a span of 6 than at a span of 12. The second treats span as a pure structure question and stops there, missing that every manager carries a pay premium over an individual contributor, so a narrow span is not only slower, it costs more. A model that shows the span, the management share, and the cost of moving to a target gives a figure a finance partner will accept.
Who this calculator fits and where to go if that is not you
It puts a number on your span of control, your management share, and what a target span would cost or save, with a board-ready summary. For the headcount a team needs from its workload, the fully loaded cost of one employee, or the pay bands your levels sit in, the right tool is next to it.
Built for
- An HR or people leader weighing whether the organization is too layered, who wants the average span, the management share, and the cost of widening or narrowing it, not just an org chart.
- A finance or operations partner sizing management overhead, who wants the manager count and the management premium at the current span and at a target.
- A founder or owner who wants to see whether they are carrying more managers than the work needs, and what reshaping spans would save.
If you are looking for
- The number of people a team needs based on its workload and demand, rather than how many a manager can oversee. The FTE Headcount Planner sizes it.
- The fully loaded annual cost of one employee or role, rather than the extra a manager carries over an individual contributor. The Employee Cost Calculator builds it up.
- The pay bands and levels the roles in your structure sit in, rather than how many report to each manager. The Salary Band Builder sets them.
Before you buy
What format is it and can I edit it?
How accurate is the result?
How is this different from the free calculator?
How do I define a people-manager and set a target span?
What is the refund policy?
What happens after I buy?
Can I expense this purchase to my business?
Most customers buy TrueStep HR tools for business use, and a tool you use for work often qualifies as a deductible business expense. Whether it does for you depends on your situation, so confirm with your accountant or tax professional. Your receipt arrives by email at checkout and works as documentation.
The 6 red flags to check before you discipline or fire someone
A five-minute screen to run before you act. Free PDF, sent to your inbox. Unsubscribe anytime.
This tool is built on published method and current rules. Read the basis yourself:
What buyers say
Put a number on your structure, not just the org chart
Enter your headcount and manager count, and the workbook returns your average span, your org layers, and what a target span would cost or save, in a file you keep.