Screenshots show the workbook with a sample structure. Your own numbers replace the example.
Salary Band Builder
Turn market pay data into a working salary structure. Set one anchor, a progression, and a spread, and the workbook builds every grade’s minimum, midpoint, and maximum, then shows where each of your people sits against their range.
One-time purchase, no subscription. Instant download.
Built to the TrueStep HR standard
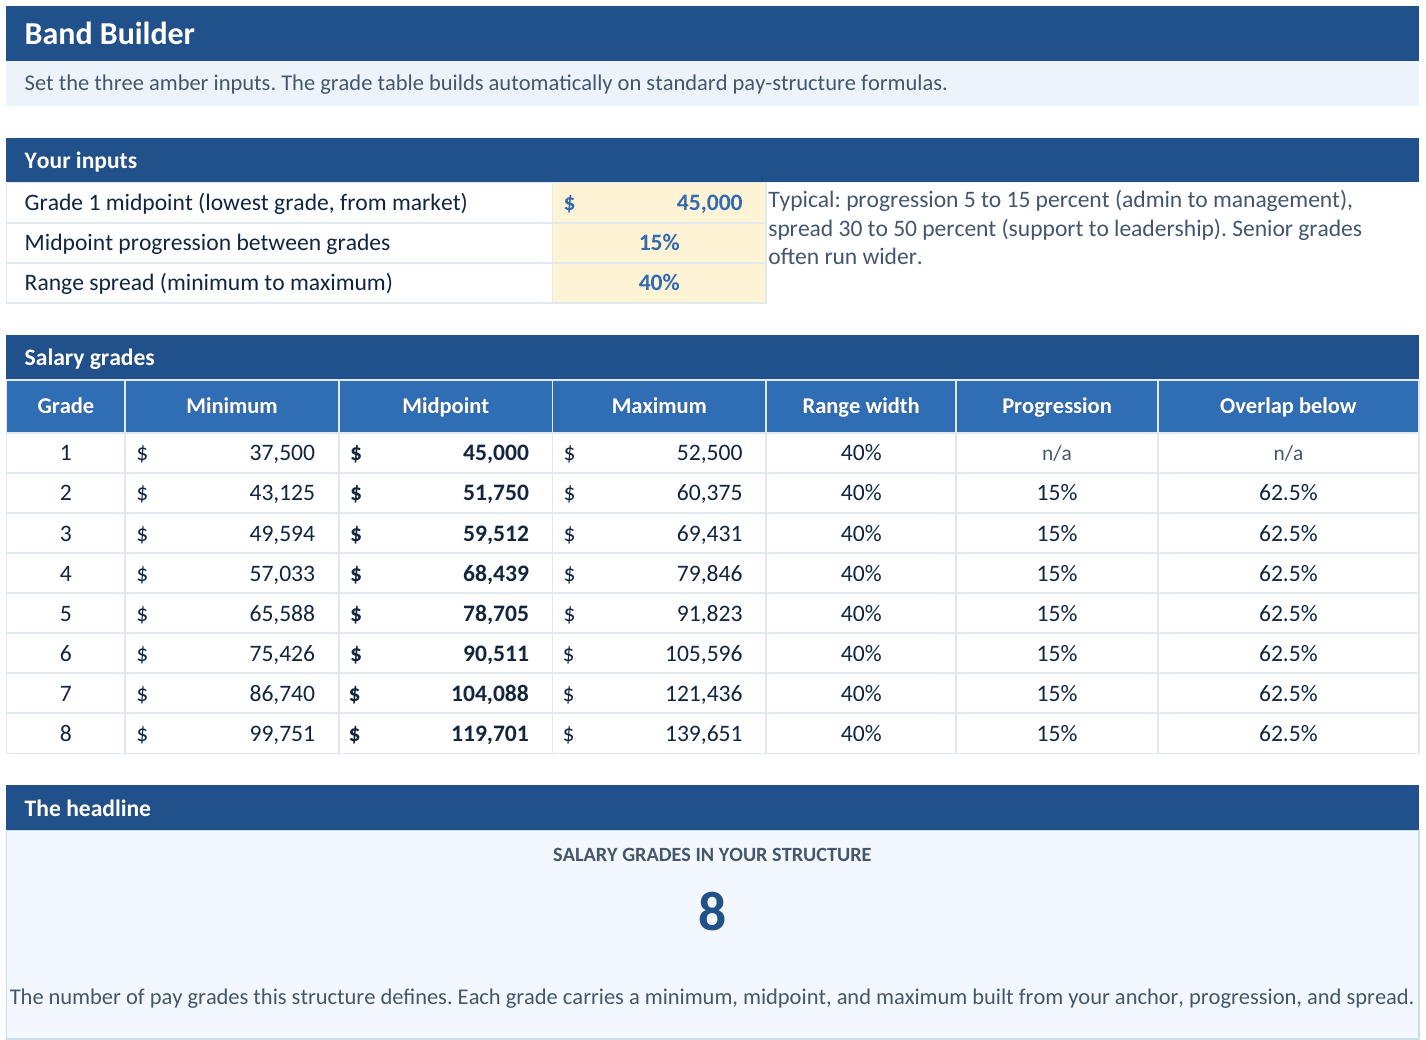
- A complete grade table from three inputs: set the Grade 1 midpoint, the progression, and the spread, and eight grades build on the standard pay-structure formulas
- A minimum, midpoint, and maximum per grade, plus range width, the step between grades, and the overlap each grade shares with the one below
- Employee placement against the ranges: enter a grade and a salary, and each person’s compa-ratio, range penetration, and status compute for you
- A one-page summary and sourced benchmarks: the structure’s shape, who sits in or out of range, and typical settings by job level
- Open, editable formulas in Excel or Google Sheets, documented on the Notes tab, with a worked example pre-filled on every tab
The workbook does the structure math. The anchor is yours to set, so pull the Grade 1 midpoint from a current salary survey at the percentile you target.
14-day money-back guarantee. If it does not help, email us and we refund you.
The structure is only as good as its market anchor, and pay changes carry legal and equity weight, so confirm current market data and review sensitive decisions with a qualified professional.
Not the right fit? Take the 60-second match.
One Excel workbook that turns market data into salary bands
A working structure, not a blank grid. You set three numbers, the workbook builds the grades, and your people get placed against real ranges. It opens on a filled-in eight-grade example so the math is clear before you change anything.
Salary Band Builder
Set the Grade 1 midpoint from your market data, the midpoint progression between grades, and the range spread from minimum to maximum. The grade table builds itself: every grade gets a minimum, midpoint, and maximum, with range width, the progression step, and the overlap against the grade below shown per row. On the Employee Placement tab, enter each person’s grade and current salary, and their compa-ratio, range penetration, and Below min, In range, or Above max status fill in from the structure.
Summary, benchmarks, and the formulas in plain English
The Summary rolls everything onto one page: the structure’s shape, how many people sit within, below, or above their range, and the average compa-ratio. The Benchmark tab lists typical range spreads and midpoint progressions by job level, summarized from published compensation guidance, so your settings have a reference point. The Notes tab documents how every number is built, including the overlap identity, and explains how to read the placement metrics.
Three steps from market data to a structure
You set the anchor and two settings, the workbook builds the grades, and the placements tell you where pay needs attention.
Set three inputs
The Grade 1 midpoint from your salary survey, the midpoint progression between grades, and the range spread. The eight-grade table builds on its own.
Place your people
Enter each person’s grade and current salary. Compa-ratio, range penetration, and an in-or-out-of-range status compute from the structure.
Read it and adjust
The Summary shows who sits below, within, or above range. Change the progression or the spread and the whole structure rebuilds, so you can test settings before you commit.
A structure built the way comp teams build them
Salary bands only hold up if the math behind them is the standard math and the settings have a reference point, so the workbook keeps both on the surface.
The rule behind thisCompa-ratio and range penetration ›Who it is built for
Who this tool fits, and where to go if that is not you.
Built for
- An HR lead or owner formalizing pay for the first time, who needs real grades and ranges instead of one-off offers.
- A comp or HR team refreshing an existing structure, testing a new progression or spread before rolling it out.
- A consultant or fractional HR lead who builds pay structures for clients and wants the math documented and defensible.
If you are looking for
- A decision on one person’s raise or promotion, not a structure. The Merit Increase Matrix turns performance and range position into an increase, and the Promotion and Internal Equity calculator pressure-tests a single move.
- What a hire costs all-in, not what the role should pay. The Employee Cost Calculator turns a salary into the fully loaded annual cost.
Before you buy
What format is it and can I edit it?
What does this workbook do that a free template does not?
Does it include salary survey data?
How many grades does it build and can the design flex?
What is the refund policy?
What happens after I buy?
Can I expense this purchase to my business?
Most customers buy TrueStep HR tools for business use, and a tool you use for work often qualifies as a deductible business expense. Whether it does for you depends on your situation, so confirm with your accountant or tax professional. Your receipt arrives by email at checkout and works as documentation.
The 6 red flags to check before you discipline or fire someone
A five-minute screen to run before you act. Free PDF, sent to your inbox. Unsubscribe anytime.
This tool is built on published method and current rules. Read the basis yourself:
What buyers say
Put real ranges behind your pay decisions
Every grade’s minimum, midpoint, and maximum from one market anchor, with your people placed against the ranges, in a file you keep.