New Hire Ramp Calculator
See what a new hire costs you before they reach full output, and what a faster ramp would save. Enter the salary, ramp time, and day-one productivity, and the workbook returns the ramp cost per hire, the annual cost across your hires, and the saving from a stronger start.
One-time purchase, no subscription. Instant download.
Built to the TrueStep HR standard
- The ramp cost of one new hire: the output lost while they climb to full speed plus the onboarding cost, with the average productivity during the ramp, the monthly loaded cost, and the cost as a share of salary, every formula visible and editable in Excel or Google Sheets
- An annual ramp cost across your hires: set how many people you bring into the role in a year for the full-year cost of ramping every one of them, not a single-hire figure
- A faster-ramp scenario, costed: set a target ramp time and a stronger day-one start, and the workbook returns the cost per hire at that target and the dollar saving across a year of hires
- Sourced ramp benchmarks: typical time to full productivity by role, from entry to senior, sales, and healthcare, cited to SHRM, Gallup, and the Bridge Group, to sense-check your ramp time
- A working file you keep: a pre-filled worked example, your numbers saved, and the method documented in plain English, not a one-time screen
The workbook computes from the numbers you enter. The salary, ramp time, day-one productivity, onboarding cost, and how many you hire in a year are yours to set.
14-day money-back guarantee. If it does not help, email us and we refund you.
The result rests most on the ramp time and the day-one productivity you set, how long the climb takes and where it starts, so set them to the role and treat the figure as a way to size the cost of ramping, not a precise ledger entry.
Not the right fit? Take the 60-second match.
One Excel workbook that turns a salary, a ramp time, and a day-one start into the cost of a new hire
A working model, not a blank sheet. You enter the role and the ramp, the workbook returns the cost per hire and what a faster ramp saves, and it opens on a worked example so the logic is clear before you change anything.
New Hire Ramp Calculator
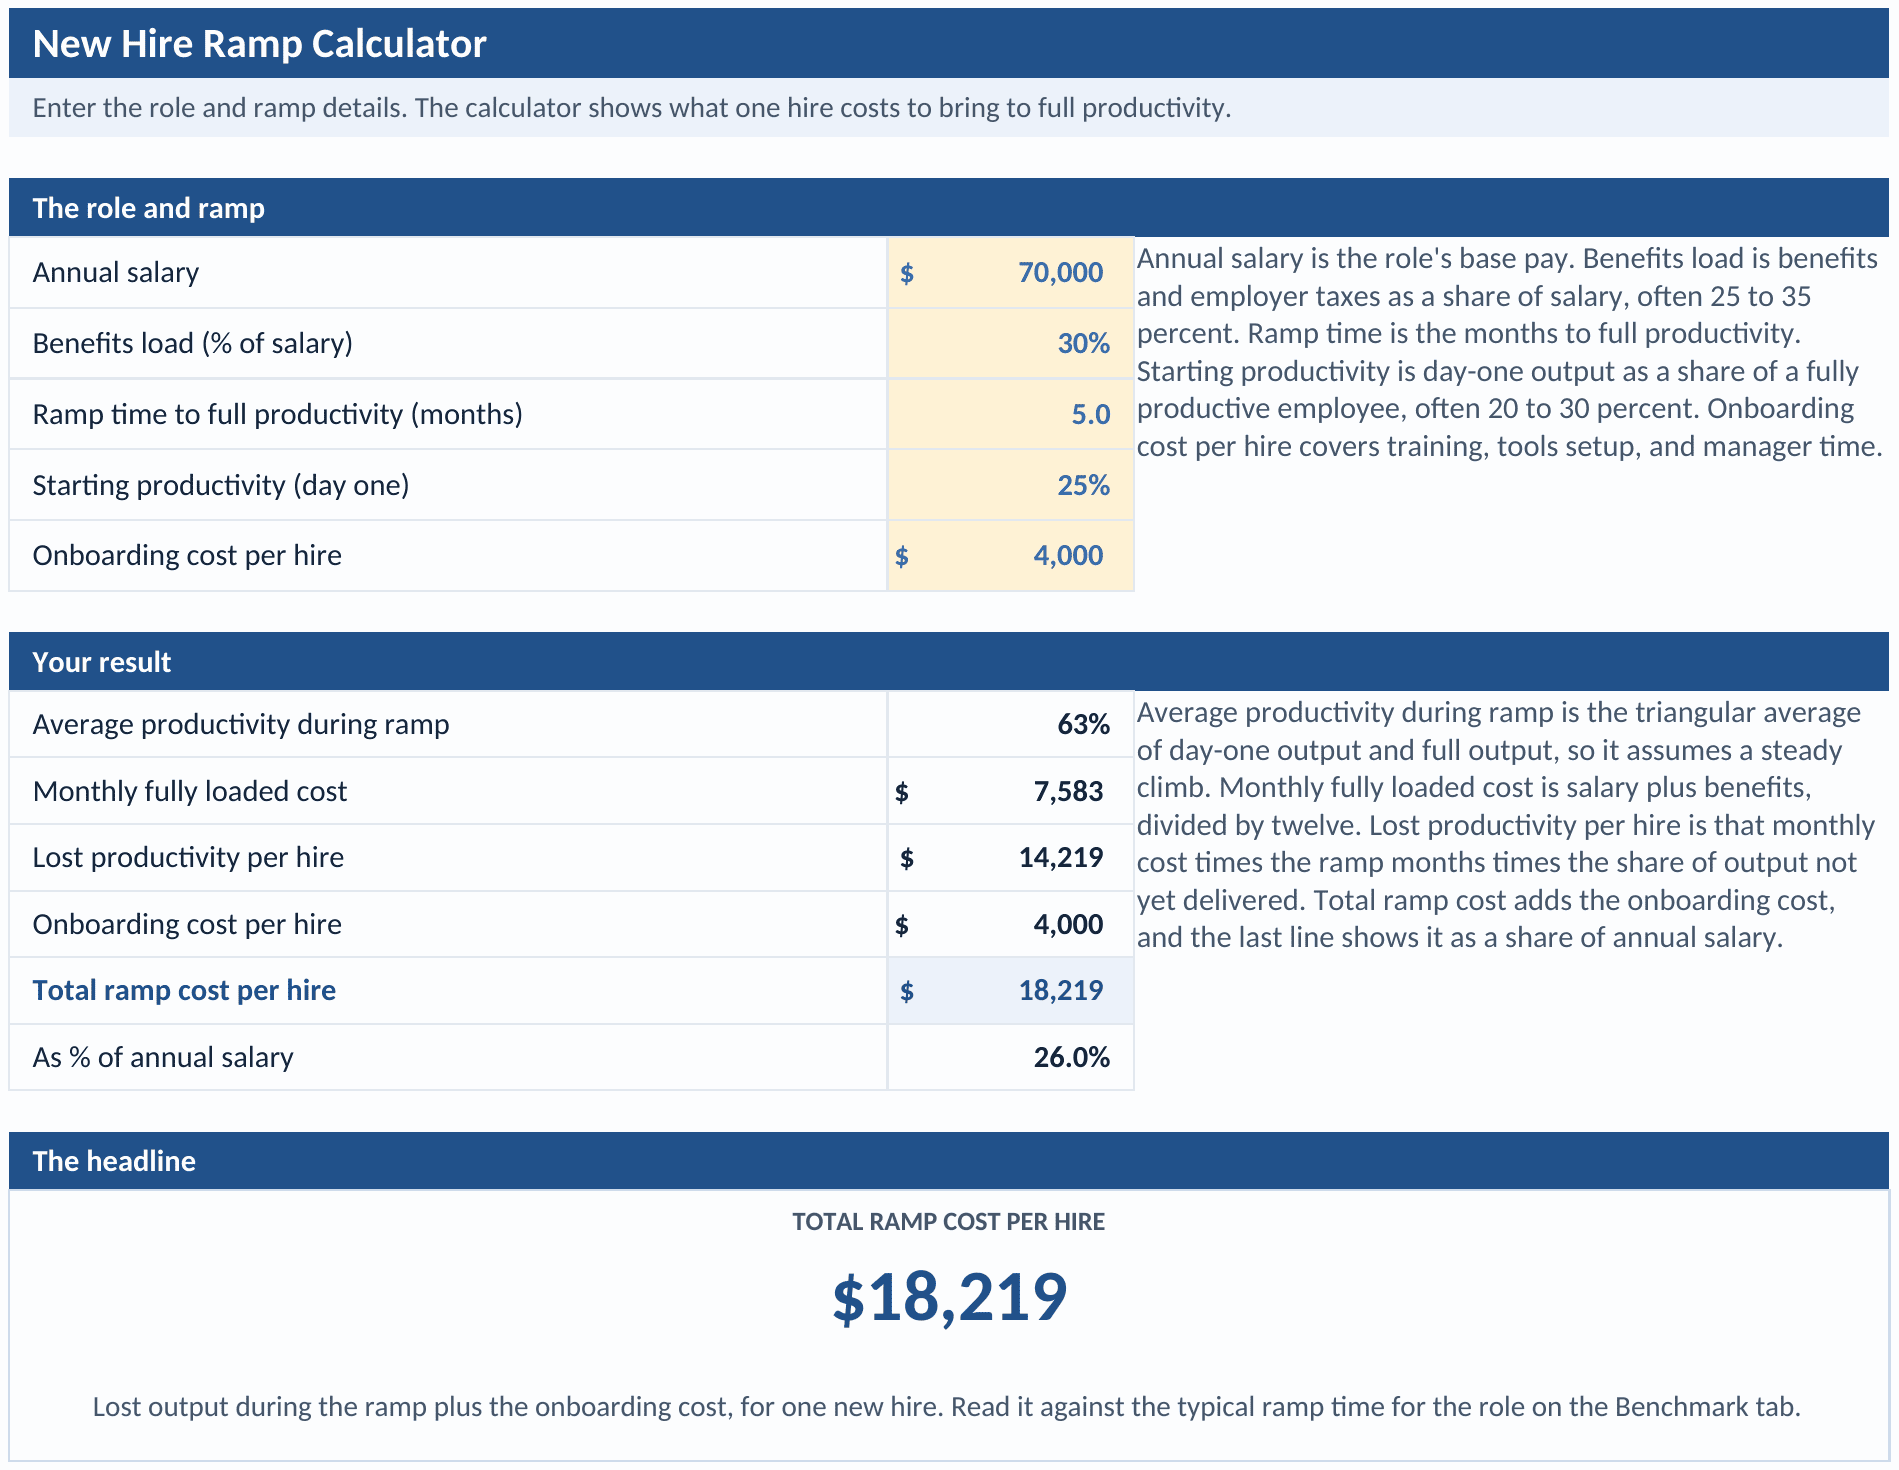
Enter the annual salary, benefits load, ramp time to full productivity, day-one productivity, and onboarding cost per hire. The workbook returns the average productivity during the ramp, the monthly fully loaded cost, the lost productivity per hire, the total ramp cost per hire, and that cost as a share of annual salary.
An annual view, a faster-ramp scenario, a board-ready summary, sourced benchmarks, and the method in plain English
An Annual and Scenario tab scales the cost across your hires and puts a dollar figure on a shorter ramp and a stronger day-one start. A one-page Summary carries the headline numbers for a leadership conversation, a Benchmark tab holds typical ramp times by role from SHRM, Gallup, and the Bridge Group, and the Notes tab documents how each number is built.
Three steps from a salary and a ramp time to the cost of a new hire
You enter the role, read the cost per hire, then test a faster ramp. The workbook does the rest.
Enter the role and the ramp
Fill the amber cells: annual salary, benefits load, ramp time to full productivity, day-one productivity, and onboarding cost per hire. The worked example runs a $70,000 role with a five-month ramp and a 25% day-one start, change it to your own numbers.
Read the cost per hire
The workbook averages output across the climb, spreads the loaded pay over the ramp months, and prices the share of output not yet delivered, then adds the onboarding cost for the total ramp cost per hire, with the cost as a share of salary alongside.
Test a faster ramp
The Annual and Scenario tab scales the cost across your hires and shows what a shorter ramp or a stronger day-one start would save in a year. Use the saving to size an onboarding or enablement investment. The Summary rolls it up for a leadership conversation.
A new hire’s salary starts on day one but full output does not
Two habits get the cost of a new hire wrong. The first counts only the salary and the onboarding bill, missing the larger cost, the output the role does not yet deliver while it climbs to full speed. The second treats the ramp as free because the person is on payroll and working, when a half-productive hire is half an unfilled role. A model that prices the lost output across the ramp, and lets you set where day one starts, gives a figure a finance partner will accept.
Who this calculator fits and where to go if that is not you
It puts a number on what a new hire costs before full output, and what a faster ramp saves, with a board-ready summary. For the recruiting spend to fill the role, the full cost of the person who left, or the return on the training itself, the right tool is next to it.
Built for
- An HR or talent leader building the case for an onboarding or enablement program who wants the cost of ramping, not just the salary and the training bill.
- A finance or operations partner who wants new hires costed across the ramp and the year, with day-one output and ramp time set to the role.
- A hiring manager or owner who wants to see what a slow start costs and what a shorter ramp or a stronger first month would save.
If you are looking for
- The recruiting spend to bring the hire in, the ads, agency fees, and staff time, rather than the output lost while they ramp. The Cost Per Hire Calculator sizes it.
- The full all-in cost of the person who left and being replaced, of which the new hire’s ramp is one part. The Cost of Turnover Calculator covers that.
- Whether the onboarding or training spend itself pays back, measured against the gain it produces. The Training ROI Calculator works that out.
Before you buy
What format is it and can I edit it?
How accurate is the result?
How is this different from the free calculator?
How do I set day-one productivity and the ramp time?
What is the refund policy?
What happens after I buy?
Can I expense this purchase to my business?
Most customers buy TrueStep HR tools for business use, and a tool you use for work often qualifies as a deductible business expense. Whether it does for you depends on your situation, so confirm with your accountant or tax professional. Your receipt arrives by email at checkout and works as documentation.
The 6 red flags to check before you discipline or fire someone
A five-minute screen to run before you act. Free PDF, sent to your inbox. Unsubscribe anytime.
This tool is built on published method and current rules. Read the basis yourself:
What buyers say
Put a number on the ramp, not just the salary
Enter the salary, ramp time, and day-one productivity, and the workbook returns the ramp cost per hire and what a faster ramp or a stronger start would save, in a file you keep.